In fulfilment of Part IV of the Environment Act 1995 Local Air Quality Management, as amended by the Environment Act 2021
Date: June 2023
| Information | Rother District Council Details |
|---|---|
| Local Authority Officer | Greg Minns |
| Department | Environmental Health |
| Address | Town Hall Bexhill on Sea East Sussex TN39 3JX |
| Telephone | 01424 787333 |
| Greg.Minns@rother.gov.uk | |
| Report Reference Number | 2023 ASR |
| Date | June 2023 |
Executive Summary: Air Quality in Our Area
Air Quality in Rother District Council
Air pollution is associated with a number of adverse health impacts. It is recognised as a contributing factor in the onset of heart disease and cancer. Additionally, air pollution particularly affects the most vulnerable in society: children, the elderly, and those with existing heart and lung conditions. There is also often a strong correlation with equalities issues because areas with poor air quality are also often less affluent areas1,2.
The mortality burden of air pollution within the UK is equivalent to 29,000 to 43,000 deaths at typical ages3, with a total estimated healthcare cost to the NHS and social care of £157 million in 20174.
Rother District Council (RDC) manages local air quality in close collaboration with East Sussex County Council (SCC), which provided part of the monitoring until 2014, and with the Sussex Air Quality Partnership (Sussex Air). The partnership provides assistance to members and information to the public via its website with recent air quality data, news updates, educational resources, links and other services such as airAlert.
Nitrogen Dioxide (NO2) concentrations have previously exceeded the annual mean Air Quality Strategy (AQS) objective in the district (the latest occasion being at A2100 Beauport Park and High Street Flimwell diffusion tube sites in 2016). However, in recent years (2018-2022) concentrations at these locations and all others were below the AQS objective.
PM10 is monitored in Rother at De La Warr Road, Bexhill, and in recent years concentrations have been generally low (well below the annual mean AQS objective of 40 µg/m3), with no significant increasing or decreasing tendency, although there is some year-on-year variability. PM2.5 was derived from the PM10 concentrations, and in recent years has not exceeded the annual mean AQS limit value of 20 µg/m3.
As in other suburban and rural areas of East Sussex, ozone (O3) is of considerable concern. O3 was monitored at Rye Harbour until 2021. The O3 monitor was decommissioned during 2022 as Sussex Air has now switched to using data from the Met Office instead in their calculations of O3 levels.
A large area of the countryside in the district is within the High Weald Area of Outstanding Natural Beauty. The impact of traffic-related air pollution on some of these areas has been assessed in past years. Current and future traffic flows are not expected to put the Pevensey Levels Special Area of Conservation at risk from excessive nitrogen deposition.
1 Public Health England. Air Quality: A Briefing for Directors of Public Health, 2017
2 Defra. Air quality and social deprivation in the UK: an environmental inequalities analysis, 2006
3 Defra. Air quality appraisal: damage cost guidance, January 2023
4 Public Health England. Estimation of costs to the NHS and social care due to the health impacts of air pollution: summary report, May 2018
Actions to Improve Air Quality
Whilst air quality has improved significantly in recent decades, there are some areas where local action is needed to protect people and the environment from the effects of air pollution.
The Environmental Improvement Plan5 sets out actions that will drive continued improvements to air quality and to meet the new national interim and long-term PM2.5 targets. The National Air Quality Strategy, published in 2023, provides more information on local authorities’ responsibilities to work towards these new targets and reduce PM2.5 in their areas. The Road to Zero6 details the approach to reduce exhaust emissions from road transport through a number of mechanisms; this is extremely important given that the majority of Air Quality Management Areas (AQMAs) are designated due to elevated concentrations heavily influenced by transport emissions.
RDC is regularly informing the public of pollution events through the airAlert pollution warning service. This service is provided and maintained through the Sussex Air partnership.
RDC contributes to the Air Quality and Emissions Mitigation Guidance for Sussex. The guidance supports the principles of the Sussex Air Quality Partnership to improve air quality across Sussex, encourage emissions reductions and improve the environment and health of the population. Other actions being implemented to improve public health include promoting active modes of transportation like walking, cycling and using public transport, as well as car clubs and car sharing.
5 Defra. Environmental Improvement Plan 2023, January 2023
6 DfT. The Road to Zero: Next steps towards cleaner road transport and delivering our Industrial Strategy, July 2018
Conclusions and Priorities
Annual mean NO2 concentrations recorded at continuous monitors and diffusion tubes in RDC are within the annual mean AQS objective of 40 µg/m3. The results also indicate that the 1-hour NO2 AQS objective is unlikely to be exceeded at any location in the district.
There were also no exceedances of either the annual mean or daily mean PM10 AQS objectives in 2022, or for the previous years from 2018.
RDC is committed to taking action to improve air quality, in particular through involvement with the Sussex Air Quality Partnership. In 2022 the Council maintained contact with Sussex Air and other Local Authority Officers working in air quality. The Council is continuing their work on a new Local Plan that will cover the period 2019-2039.
The main challenge in maintaining the generally good levels of air quality across the district is likely to be the careful management of planning applications and developments. Detailed and rigorous air quality assessments and mitigation cost calculations will continue to be needed, especially where multiple developments may occur close together.
There are four main priorities for addressing air quality in 2023 and beyond. These are:
- The installation of a PM2.5/PM10 combined analyser in Rother.
- To commence PM2.5 monitoring to establish baseline concentrations. To continue working with Sussex Air on the successful DEFRA bid to obtain such data across Sussex.
- To work with the new Environment Manager in RDC to introduce policies into the local plan to help improve air quality through the planning system.
- To continue work with Sussex Air and other Local Authorities and consult on the Draft Environment Strategy and Action Plan 2020-2030 to ensure air quality mitigation is adequately addressed.
Local Engagement and How to get Involved
Everyone concerned about air quality in Rother and the rest of Sussex can find real-time information on pollution levels on the Sussex Air website sussex-air.net. People are encouraged to sign up for advance warnings with the airAlert service at airalert.info.
Warnings are provided by text or voice message, email, or using an Android or iOS app. Additionally, members of the public should engage with Sustrans, who work with Sussex Air to go into local schools to undertake education programs about the importance of air quality.
Drivers planning to replace their vehicles are encouraged to consider low and ultra-low emission vehicles, such as electric cars, plug-in hybrids and extended-range electric vehicles. The Energise Network provides members with access to more than 150 electric vehicle charging points across the South East. These include most local authority charge points in Kent, Surrey and Sussex, plus a number of Southern Rail fast chargers. For more details, please visit Zapmap. The reduction in using cars to travel to work, continued home working and increasing walking and cycling post Covid-19 are encouraged.
Local Responsibilities and Commitment
This ASR was prepared by the Environmental Health Department of Rother District Council with the support and agreement of the following officers and departments:
Greg Minns (Environmental Health)
If you have any comments on this ASR please send them to Greg Minns at: Town Hall, Bexhill on Sea East Sussex TN39 3JX Greg.Minns@rother.gov.uk
1. Local Air Quality Management
This report provides an overview of air quality in Rother District Council during 2022. It fulfils the requirements of Local Air Quality Management (LAQM) as set out in Part IV of the Environment Act (1995), as amended by the Environment Act (2021), and the relevant Policy and Technical Guidance documents.
The LAQM process places an obligation on all local authorities to regularly review and assess air quality in their areas, and to determine whether or not the air quality objectives are likely to be achieved. Where an exceedance is considered likely the local authority must declare an Air Quality Management Area (AQMA) and prepare an Air Quality Action Plan (AQAP) setting out the measures it intends to put in place in order to achieve and maintain the objectives and the dates by which each measure will be carried out. This Annual Status Report (ASR) is an annual requirement showing the strategies employed by RDC to improve air quality and any progress that has been made.
The statutory air quality objectives applicable to LAQM in England are presented in Table E.1.
2. Actions to Improve Air Quality
Air Quality Management Areas
Air Quality Management Areas (AQMAs) are declared when there is an exceedance or likely exceedance of an air quality objective. After declaration, the authority should prepare an Air Quality Action Plan (AQAP) within 18 months. The AQAP should specify how air quality targets will be achieved and maintained, and provide dates by which measures will be carried out.
RDC currently does not have any declared AQMAs, because previous monitoring and modelling studies have not indicated any likelihood of the AQS objectives being exceeded.
Since RDC has no AQMAs, no formal AQAP has been implemented for the district.
Table 2.1 – Declared Air Quality Management Areas
Rother District Council has no declared AQMAs.
- Rother District Council confirm the information on UK-Air regarding their AQMA(s) is up to date.
- Rother District Council confirm that all current AQAPs have been submitted to Defra.
Progress and Impact of Measures to address Air Quality in Rother District Council
Defra’s appraisal of last year’s ASR concluded the report was well structured, detailed, and provided the information specified in the Guidance. The following comments were provided, which have been addressed in this year’s report:
- The Council has a triplicate diffusion tube site co-located with an automatic monitor. There was good discussion provided around the choice to use the local bias adjustment factor. A factor of 0.84 was utilised and stated to be taken from the 03/22 version of the national bias adjustment spreadsheet. It is recommended that the latest available version of the national bias adjustment spreadsheet should be used prior to submission. Despite this, the factor has remained consistent between both the 03/22 and 06/22 versions. The latest available version of the national bias adjustment spreadsheet has been used for this ASR.
- It was not stated whether the Diffusion Tube Data Processing Tool was used, however results were calculated correctly and presented clearly. It is encouraged that the Diffusion Tube Data Processing Tool is used as this uses the most up-to-date and appropriate methods for data processing, and the Council should state which version has been used. The diffusion tube data processing tool has been used in previous years and this has been stated in this year’s ASR.
- Estimations of PM2.5 from PM10 whilst no PM2.5 monitoring is carried out is welcomed. However please note that the methodology to estimate this has changed within LAQM.TG(22) and should be followed for all future reports. The latest methodology has been used for calculations in this report.
- It would be beneficial to state whether the LAQM Diffusion Tube Calendar has been adhered with, or whether there have been any disruptions/changes to the recommended exposure periods. This has been stated in this year’s ASR in the section QA/QC of Diffusion Tube Monitoring.
RDC has taken forward a number of direct measures during the current reporting year of 2022 in pursuit of improving local air quality. Details of all measures completed, in progress or planned are set out in Table 2.2. Seven measures are included within Table 2.2, with the type of measure and the progress RDC have made during the reporting year of 2022 presented. Where there have been, or continue to be, barriers restricting the implementation of the measure, these are also presented within Table 2.2.
Key achievements by RDC during 2022 include:
- Begun working with Sussex Air to re-write planning conditions, to improve air quality through the planning system. This re-write will also involve Sustainability officers.
- Review of diffusion tube locations and selection of five new locations for data collection in 2022. This is to establish baseline conditions in areas which might be more greatly impacted by traffic from future housing developments: to help better inform reports undertaken by consultants through the planning process. Especially as some existing tube locations have shown low and similar levels of NO2 over many years (for example some rural background sites) and some were considered to be in less useful areas for identifying any risk to human receptors.
RDC’s priorities for the coming year are:
- The installation of a PM2.5/PM10 combined analyser in Rother.
- To commence PM2.5 monitoring to establish baseline concentrations. To continue working with Sussex Air on the successful DEFRA bid to obtain such data across Sussex.
- Finish writing planning conditions with Sussex Air.Work with the new Environment Manager in RDC to introduce policies into the local plan to help improve air quality through the planning system (in line with RDCs Environment Strategy).
- Working with the Sustainability team with respect to the roll out of eV charge points.
- The principal challenges and barriers to implementation that RDC anticipates facing are;
- Consistently very high staff workloads, meaning that work on Air Quality and introduction of the PM2.5 analyser is not of high priority.
- Lack of funds available to employ and retain staff.
- Working with the EA and Trading standards on PM2.5 work will be challenging.
Table 2.2 – Progress on Measures to Improve Air Quality
| Measure No. | Measure | Category | Classification | Year Measure Introduced | Estimated / Actual Completion Year | Organisations Involved | Funding Source | Defra AQ Grant Funding | Funding Status | Estimated Cost of Measure | Measure Status | Reduction in Pollutant / Emission from Measure | Key Performance Indicator | Progress to Date | Comments / Barriers to Implementation |
|---|---|---|---|---|---|---|---|---|---|---|---|---|---|---|---|
| 1 | Air Quality and Emissions Mitigation Guidance for Sussex | Policy Guidance and Development Control | Air Quality Planning and Policy Guidance | 2014 | 2019 | Sussex Air Quality Partnership | – | – | – | – | Completed | N/A | N/A | Completed | – |
| 2 | Air Quality Strategic Plan 2010 | Policy Guidance and Development Control | Regional Groups Co- ordinating programmes to develop Area wide Strategies to reduce emissions and improve air quality | 2010 | Ongoing | Sussex Air Quality Partnership | – | √ | Successful funding as part of a joint bid to DEFRA for a PM2.5 analyser | – | Implementation | N/A | N/A | Combined PM2.5 and PM10 analyser has been purchased. Hoping for installation in June 2023 | On going work with Sussex Air The increase in interest rates during Liz Truss’ premiership in particular, rapidly and significantly reduced the amount of funding available, meaning that the original plans had to be modified significantly. Now having to install a combined analyser in the old cabinet because could no longer afford a new cabinet too. |
| 3 | Sussex Air website / Air Alert | Public Information | Via the Internet | 2014 | Ongoing | Sussex Air Quality Partnership | – | – | – | – | Implementation | N/A | Number of subscribers to AirAlert | Ongoing | – |
| 4 | Council Policy for Homeworking | Promoting Travel Alternatives | Encourage / Facilitate home- working | 2014 | Ongoing | Rother District Council | – | – | – | – | Implementation | N/A | N/A | Ongoing | – |
| 5 | Active Rother | Promoting Travel Alternatives | Promotion of Cycling | 2016 | Ongoing | Rother District Council | – | – | – | – | Implementation | N/A | N/A | Ongoing | – |
| 6 | Rothers Cycling and Walking Strategy | Promoting Travel Alternatives | Promotion of Walking | 2016 | Ongoing | Rother District Council | – | – | – | – | Implementation | N/A | N/A | Ongoing | – |
| 7 | Transport for the South East | Traffic Management | Other | 2020 | Ongoing | Transport for the South East Regional Decarbonisation Forum | – | – | – | – | Planning | N/A | N/A | Initial Engaement | – |
PM2.5 – Local Authority Approach to Reducing Emissions and/or Concentrations
As detailed in Policy Guidance LAQM.PG22 (Chapter 8), local authorities are expected to work towards reducing emissions and/or concentrations of PM2.5 (particulate matter with an aerodynamic diameter of 2.5µm or less). There is clear evidence that PM2.5 has a significant impact on human health, including premature mortality, allergic reactions, and cardiovascular diseases.
The Public Health Outcomes Framework includes an indicator relating to the impact of particulate pollution on human health. Indicator D01 – Fraction of mortality attributable to particulate air pollution (new method) provides an estimation of the mortality burden associated with long-term exposure to PM2.5 as a percentage of the annual deaths from all causes in those aged 30+. The D01 indicator value for Rother is 4.5% in 2021. This is below the regional average for the South East (5.4%) and the national English average (5.5%).
RDC is taking the following measures to address PM2.5:
- Took part in a joint bid from Sussex Authorities to Defra to secure funding for a new PM2.5 analyser for Rother/Wealden and walk in cabinet. The bid was successful and combined PM10/2.5 analyser has been purchased. This will be installed during June 2023.
- Continued engagement with Transport for the South East, which aims to decarbonise the transport sector;
- Continuing to support the Energise Network of electric vehicle charging points, together with the Sussex Air Quality Partnership;
- Discussions are being held with Public Health and other Local Authorities as part of Sussex Air to re-write planning conditions with a view to improving air quality through the planning process; and
- Publishing information discouraging the burning of garden waste and encouraging sustainable alternatives such as composting and recycling.
3. Air Quality Monitoring Data and Comparison with Air Quality Objectives and National Compliance
This section sets out the monitoring undertaken within 2022 by RDC and how it compares with the relevant air quality objectives. In addition, monitoring results are presented for a five-year period between 2018 and 2022 to allow monitoring trends to be identified and discussed.
Summary of Monitoring Undertaken
3.1.1 Automatic Monitoring Sites
RDC undertook automatic (continuous) monitoring at one site during 2022: De La Warr Road, Bexhill (RY2, monitoring nitrogen dioxide (NO2) and particulate matter with an aerodynamic diameter of 10µm or less (PM10)). This station is part of the Sussex Air Quality Monitoring Network (SAQMN). Regional monitoring results are available at www.sussex-air.net.
Data capture for 2022 was good, as outlined below:
- De La Warr Road, Bexhill: 99.2% for NO2 and 98.3% for PM10.
RDC previously had a continuous monitor at Rye Harbour (RY1, monitoring O3). However, the O3 monitor was decommissioned during 2022 as Sussex Air has now switched to using data from the Met Office instead in their calculations of O3 levels.
PM2.5 is currently not monitored in the district. Table A.1 in Appendix A shows the details of the automatic monitoring sites.
Maps showing the location of the monitoring sites are provided in Appendix D. Further details on how the monitors are calibrated and how the data has been adjusted are included in Appendix C.
3.1.1 Non-Automatic Monitoring Sites
RDC undertook non- automatic (i.e. passive) monitoring of NO2 at 20 sites during 2022. Triplicate diffusion tubes are co-located with the De La Warr Road automatic monitoring
station for the derivation of a local bias adjustment factor. Table A.2 in Appendix A presents the details of the non-automatic sites.
Due to repeated tube theft at Rye Cinque Ports Street (DT19), monitoring was ceased at this site at the end of 2016. This site was later reinstated in a slightly different location along Cinque Ports Street in May 2017, where data capture has significantly improved. The diffusion tube at Rye South Undercliff (DT21) was relocated in September 2016 to another location (A259 Bowling Green, Rye; DT30) due to a temporary issue with accessing the site. The Rye South Undercliff (DT21) diffusion tube site was reinstated at the original location in March 2017 after issues with access to the site had been resolved, and monitoring continued at the new DT30 site. Diffusion tube site (DT31) was commissioned in March 2017 at 128 Barnhorn Road, Bexhill.
Following an annual review of monitoring locations by RDC, five sites were decommissioned during 2022: DT2 (A28 North Of Northam), DT4 (A269 Battle Hospital), DT7 (Holliers Hill Bex), DT9 (A21 North of Robertsbridge) and DT16 (Battle High St). Five new sites were introduced during 2022: DT32 (Claverham North Trade Rd, Battle), DT33 (145 Ninfield Road, Sidley), DT34 (Mount Street, Battle), DT35 (Station Road, Hurst Green) and DT36 (Doleham Lane). Data capture was generally high at these new locations.
Maps showing the location of the monitoring sites are provided in Appendix D. Further details on Quality Assurance/Quality Control (QA/QC) for the diffusion tubes, including bias adjustments and any other adjustments applied (e.g. annualisation and/or distance correction), are included in Appendix C.
Individual Pollutants
The air quality monitoring results presented in this section are, where relevant, adjusted for bias, annualised (where the annual mean data capture is below 75% and greater than 25%), and distance corrected. Further details on adjustments are provided in Appendix C.
3.1.1 Nitrogen Dioxide (NO2)
Table A.3 and Table A.4 in Appendix A compare the ratified and adjusted monitored NO2 annual mean concentrations for the past five years with the AQS objective of 40 µg/m3. Note that the concentration data presented represents the concentration at the location of the monitoring site, following the application of bias adjustment and annualisation, as
required (i.e. the values are exclusive of any consideration to fall-off with distance adjustment).
For diffusion tubes, the full 2022 dataset of monthly mean values is provided in Appendix
B. Note that the concentration data presented in Table B.1 does not include distance corrected values, as all bias-adjusted concentrations were below 36 µg/m3 in 2022.
Defra’s Diffusion Tube Data Processing Tool v3.0 (March 2023) has been used to process all diffusion tube results.
The results indicate that the annual mean NO2 concentrations at the De La Warr Road, Bexhill automatic monitoring site were well within the AQS objective (40 µg/m3) in all years between 2018 and 2022. Figure A.1 shows that the trend in annual mean NO2 concentrations at De La Warr Road is relatively static with some variability year to year, although there was a notable decrease in concentrations between 2019 and 2020.
All diffusion tube sites achieved the AQS objective in 2022, with the highest concentration of 26.0 µg/m3 monitored at DT3 (A2100 Beauport Park). The lowest concentration of 8.4 µg/m3 was monitored at DT13 (Battle Wellington Gardens). Data capture for all tubes in 2022 was equal or greater than 75%. Figure A.2 shows NO2 concentrations at most diffusion tube locations remained fairly constant between 2021 and 2022.
Table A.5 in Appendix A compares the ratified continuous monitored NO2 hourly mean concentrations for the past five years with the AQS objective of 200 µg/m3, not to be exceeded more than 18 times per year.
The De La Warr Road, Bexhill automatic monitoring site did not exceed the 200 µg/m3
AQS objective in any year in the 2018 to 2022 period.
Diffusion tubes cannot provide hourly measurements of NO2; however, the Defra Technical Guidance states that where annual mean NO2 concentrations measured by diffusion tubes exceed 60 µg/m3 there is a likelihood that the 1-hour AQS objective may be exceeded. All of the annual mean NO2 concentrations at diffusion tube monitoring locations between 2018 and 2022 inclusive, were well below 60 µg/m3 and so the 1-hour AQS objective is very unlikely to have been exceeded. The results indicate that the 1-hour NO2 AQS objective is unlikely to be exceeded at any location in the district.
3.1.4 Particulate Matter (PM10)
PM10 concentrations are monitored in the district at the monitoring site De La Warr Road, Bexhill. Table A.6 in Appendix A: Monitoring Results compares the ratified and adjusted monitored PM10 annual mean concentrations for the past five years with the AQS objective of 40 µg/m3. The results indicate that annual mean PM10 concentrations were well below the AQS objective between 2018 and 2022. Figure A.3 shows some evidence of a slight upward trend in PM10 concentrations at De La Warr Road, although with considerable year to year variability.
Table A.7 in Appendix A compares the ratified continuous monitored PM10 daily mean concentrations for the past five years with the AQS objective of 50 µg/m3, not to be exceeded more than 35 times per year. These results show that the De La Warr Road site achieved the daily PM10 objective every year from 2018 and 2022.
3.1.1 Particulate Matter (PM2.5)
There is no PM2.5 monitoring undertaken within RDC. The annual mean PM10 concentrations measured at the De La Warr Road site have been used to estimate PM2.5 annual average concentrations. The method applied for 2022 data is as per LAQM.TG(22). There are no local sites measuring both PM10 and PM2.5 close to De La Warr Road so the National PMcoarse Roadside factor has been used. As per Defra’s Website, the National PMcoarse Roadside factor is 6.4 for 2022. To calculate the annual PM2.5 concentration the nationally derived correction factor is subtracted from the annual mean PM10 concentration.
Based on these assumptions, the estimated annual mean PM2.5 concentrations during the 2018 and 2022 period were in the range of 15 µg/m3 to 19 µg/m3. Figure A.5 shows a stable trend in estimated PM2.5 concentrations but with some year on year variability. It should be noted that there was an increase in concentrations during 2021 but this is an exception, with there being no particular long-term trend over the past five years.
Table A.8 in Appendix A presents the estimated monitored PM2.5 annual mean concentrations for the past five years.
Appendix A: Monitoring Results
Table A.1 – Details of Automatic Monitoring Sites
| Site ID | Site Name | Site Type | X OS Grid Ref (Easting) | Y OS Grid Ref (Northing) | Pollutants Monitored | In AQMA? Which AQMA? | Monitoring Technique | Distance to Relevant Exposure (m) (1) | Distance to kerb of nearest road (m) (2) | Inlet Height (m) |
|---|---|---|---|---|---|---|---|---|---|---|
| RY2 | De La Warr Road | Kerbside | 575595 | 108054 | NO2, PM10 | N | Chemiluminiscence, TEOM | N (2m) | 1m | 2.02 |
Notes:
- 0m if the monitoring site is at a location of exposure (e.g. installed on the façade of a residential property).
- N/A if not applicable
Table A.2 – Details of Non-Automatic Monitoring Sites
| Diffusion Tube ID | Site Name | Site Type | X OS Grid Ref (Easting) | Y OS Grid Ref (Northing) | Pollutants Monitored | In AQMA? Which AQMA? | Distance to Relevant Exposure (m) (1) | Distance to kerb of nearest road (m) (2) | Tube Co- located with a Continuous Analyser? | Tube Height (m) |
|---|---|---|---|---|---|---|---|---|---|---|
| DT3 | Beauport Park | Kerbside | 578727 | 113439 | NO2 | NO | >150 | 1.0 | No | 1.8 |
| DT5 | B2089 West of Rye | Kerbside | 591196 | 120213 | NO2 | NO | 50.0 | 1.0 | No | 2.2 |
| DT8 | A259 New Winchelsea Rd Rye | Kerbside | 591652 | 119148 | NO2 | NO | 10.0 | 1.0 | No | 1.8 |
| DT10 | Catsfield Church | Kerbside | 572742 | 113521 | NO2 | NO | 15.0 | 1.0 | No | 2.1 |
| DT12 | London Rd Flimwell | Kerbside | 571431 | 131224 | NO2 | NO | 5.0 | 1.0 | No | 2.0 |
| DT13 | Wellington Gardens Battle | Urban Background | 574357 | 116222 | NO2 | NO | 30.0 | N/A | No | 2.1 |
| DT14 | A2100 Virgins Lane Battle | Kerbside | 574509 | 116846 | NO2 | NO | 10.0 | 1.0 | No | 2.2 |
| DT17 | North Salts Rye | Urban Background | 592339 | 120975 | NO2 | NO | 15.0 | 1.0 | No | 2.1 |
| DT19 | Cinque Port St Rye | Urban Background | 592121 | 120543 | NO2 | NO | 8.0 | N/A | No | 2.1 |
| DT21 | South Under Cliff Rye | Kerbside | 592011 | 120148 | NO2 | NO | 2.0 | 1.0 | No | 2.3 |
| DT22 | Sackville Road Bex | Kerbside | 573985 | 107409 | NO2 | NO | 2.0 | 1.0 | No | 2.1 |
| DT25 | King Offa Way Bex | Kerbside | 573871 | 108033 | NO2 | NO | 20.0 | 1.0 | No | 2.1 |
| DT27, DT28, DT29 | Bexhill | Kerbside | 575595 | 108060 | NO2 | NO | 15.0 | 1.0 | Yes | 2.0 |
| DT30 | Bowling Green Rye | Kerbside | 592248 | 120525 | NO2 | NO | 0.0 | 1.0 | No | 2.0 |
| DT31 | 128 Barnhorn Rd Bex | Kerbside | 570366 | 107817 | NO2 | NO | 10.0 | 1.0 | No | 2.0 |
| DT32 | Claverham North Trade Rd, Battle | Kerbside | 573508 | 115907 | NO2 | NO | 25.0 | 1.0 | No | 2.4 |
| DT33 | 145 Ninfield Road, Sidley | Kerbside | 573601 | 109437 | NO2 | NO | 7.0 | 0.5 | No | 1.9 |
| DT34 | Mount Street, Battle | Kerbside | 574736 | 116123 | NO2 | NO | 11.0 | 0.5 | No | 2.3 |
| DT35 | Station Road, Hurst Green | Roadside | 573349 | 127206 | NO2 | NO | 16.0 | 1.5 | No | 2.4 |
| DT36 | Doleham Lane | Rural | 582877 | 116604 | NO2 | NO | 404.0 | 0.3 | No | 2.0 |
Notes:
- 0m if the monitoring site is at a location of exposure (e.g. installed on the façade of a residential property).
- N/A if not applicable.
Table A.3 – Annual Mean NO2 Monitoring Results: Automatic Monitoring (µg/m3)
| Site ID | X OS Grid Ref (Easting) | Y OS Grid Ref (Northing) | Site Type | Valid Data Capture for Monitoring Period (%) (1) | Valid Data Capture 2022 (%) (2) | 2018 | 2019 | 2020 | 2021 | 2022 |
|---|---|---|---|---|---|---|---|---|---|---|
| RY2 | 575595 | 108054 | Kerbside | 99.2 | 99.2 | 20.1 | 20.2 | 14.9 | 14.0 | 14.7 |
- Annualisation has been conducted where data capture is <75% and >25% in line with LAQM.TG22.
- Reported concentrations are those at the location of the monitoring site (annualised, as required), i.e. prior to any fall-off with distance correction.
Notes:
The annual mean concentrations are presented as µg/m3.
Exceedances of the NO2 annual mean objective of 40µg/m3 are shown in bold.
All means have been “annualised” as per LAQM.TG22 if valid data capture for the full calendar year is less than 75%. See Appendix C for details.
Concentrations are those at the location of monitoring and not those following any fall-off with distance adjustment.
- Data capture for the monitoring period, in cases where monitoring was only carried out for part of the year.
- Data capture for the full calendar year (e.g. if monitoring was carried out for 6 months, the maximum data capture for the full calendar year is 50%).
Table A.4 – Annual Mean NO2 Monitoring Results: Non-Automatic Monitoring (µg/m3)
| Diffusion Tube ID | X OS Grid Ref (Easting) | Y OS Grid Ref (Northing) | Site Type | Valid Data Capture for Monitoring Period (%) (1) | Valid Data Capture 2022 (%) (2) | 2018 | 2019 | 2020 | 2021 | 2022 |
|---|---|---|---|---|---|---|---|---|---|---|
| DT3 | 578727 | 113439 | Kerbside | 100 | 100.0 | 34.5 | 33.3 | 27.3 | 25.1 | 26.4 |
| DT5 | 591196 | 120213 | Kerbside | 92.3 | 92.3 | 28.7 | 26.4 | 20.7 | 18.6 | 18.8 |
| DT8 | 591652 | 119148 | Kerbside | 100 | 100.0 | 21.4 | 19.7 | 16.4 | 15.5 | 16.7 |
| DT10 | 572742 | 113521 | Kerbside | 90.4 | 90.4 | 13.2 | 13.0 | 9.0 | 9.1 | 9.1 |
| DT12 | 571431 | 131224 | Kerbside | 100 | 100.0 | 36.6 | 35.6 | 23.0 | 24.4 | 23.2 |
| DT13 | 574357 | 116222 | Urban Background | 90.4 | 90.4 | 12.1 | 11.9 | 8.9 | 8.9 | 8.4 |
| DT14 | 574509 | 116846 | Kerbside | 82.7 | 82.7 | 28.6 | 28.6 | 20.0 | 21.7 | 18.9 |
| DT17 | 592339 | 120975 | Urban Background | 92.3 | 92.3 | 13.9 | 13.6 | 11.0 | 10.3 | 10.3 |
| DT19 | 592121 | 120543 | Urban Background | 90.4 | 90.4 | 23.7 | 22.1 | 17.5 | 16.5 | 16.5 |
| DT21 | 592011 | 120148 | Kerbside | 92.3 | 92.3 | 36.8 | 35.0 | 26.0 | 26.0 | 25.8 |
| DT22 | 573985 | 107409 | Kerbside | 84.6 | 84.6 | 28.8 | 29.4 | 21.2 | 22.7 | 21.2 |
| DT25 | 573871 | 108033 | Kerbside | 100 | 100.0 | 29.8 | 28.7 | 22.7 | 23.5 | 23.3 |
| DT27, DT28, DT29 | 575595 | 108060 | Kerbside | 100 | 100.0 | 21.0 | 19.9 | 15.3 | 16.1 | 16.5 |
| DT30 | 592248 | 120525 | Kerbside | 100 | 100.0 | 22.6 | 21.8 | 16.9 | 17.3 | 17.0 |
| DT31 | 570366 | 107817 | Kerbside | 100 | 100.0 | 24.6 | 23.4 | 17.6 | 18.5 | 19.1 |
| DT32 | 573508 | 115907 | Kerbside | 100 | 100.0 | 17.1 | ||||
| DT33 | 573601 | 109437 | Kerbside | 100 | 100.0 | 18.1 | ||||
| DT34 | 574736 | 116123 | Kerbside | 82.7 | 82.7 | 13.3 | ||||
| DT35 | 573349 | 127206 | Roadside | 80.8 | 80.8 | 17.9 | ||||
| DT36 | 582877 | 116604 | Rural | 100 | 100.0 | 9.0 |
- Annualisation has been conducted where data capture is <75% and >25% in line with LAQM.TG22.
- Diffusion tube data has been bias adjusted.
- Reported concentrations are those at the location of the monitoring site (bias adjusted and annualised, as required), i.e.prior to any fall-off with distance correction.
Notes:
The annual mean concentrations are presented as µg/m3.
Exceedances of the NO2 annual mean objective of 40µg/m3 are shown in bold.
NO2 annual means exceeding 60µg/m3, indicating a potential exceedance of the NO2 1-hour mean objective are shown in bold and underlined.
Means for diffusion tubes have been corrected for bias. All means have been “annualised” as per LAQM.TG22 if valid data capture for the full calendar year is less than 75%. See Appendix C for details.
Concentrations are those at the location of monitoring and not those following any fall-off with distance adjustment.
- Data capture for the monitoring period, in cases where monitoring was only carried out for part of the year.
- Data capture for the full calendar year (e.g. if monitoring was carried out for 6 months, the maximum data capture for the full calendar year is 50%).
Figure A.1 – Trends in Annual Mean NO2 Concentrations (Automatic Sites)
Figure A.2 – Trends in Annual Mean NO2 Concentrations (Diffusion Tube Sites)
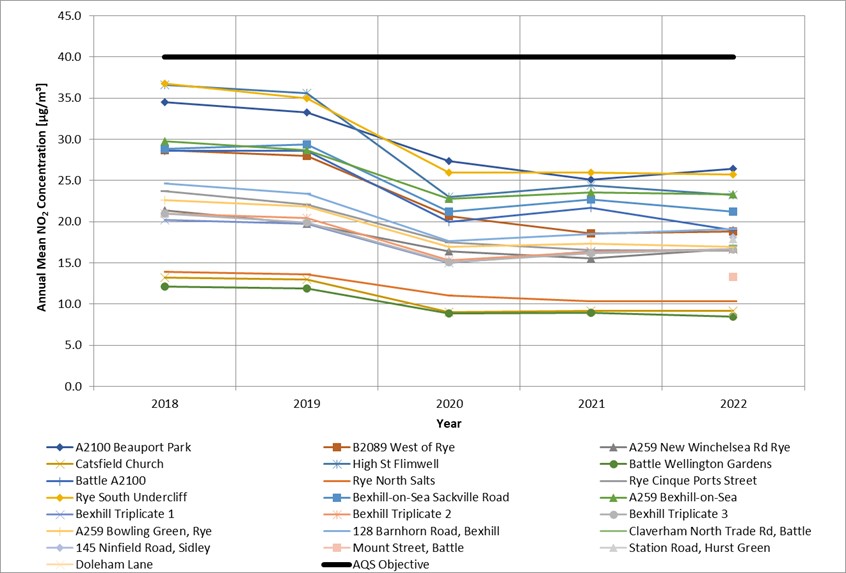
Table A.5 – 1-Hour Mean NO2 Monitoring Results, Number of 1-Hour Means > 200µg/m3
| Site ID | X OS Grid Ref (Easting) | Y OS Grid Ref (Northing) | Site Type | Valid Data Capture for Monitoring Period (%) (1) | Valid Data Capture 2022 (%) (2) | 2018 | 2019 | 2020 | 2021 | 2022 |
|---|---|---|---|---|---|---|---|---|---|---|
| RY2 | 575595 | 108054 | Kerbside | Automatic | 99.2 | 0 | 0 | 0 | 0 | 0 |
Notes:
Results are presented as the number of 1-hour periods where concentrations greater than 200µg/m3 have been recorded. Exceedances of the NO2 1-hour mean objective (200µg/m3 not to be exceeded more than 18 times/year) are shown in bold. If the period of valid data is less than 85%, the 99.8th percentile of 1-hour means is provided in brackets.
- Data capture for the monitoring period, in cases where monitoring was only carried out for part of the year.
- Data capture for the full calendar year (e.g. if monitoring was carried out for 6 months, the maximum data capture for the full calendar year is 50%).
Table A.6 – Annual Mean PM10 Monitoring Results (µg/m3)
| Site ID | X OS Grid Ref (Easting) | Y OS Grid Ref (Northing) | Site Type | Valid Data Capture for Monitoring Period (%) (1) | Valid Data Capture 2022 (%) (2) | 2018 | 2019 | 2020 | 2021 | 2022 |
|---|---|---|---|---|---|---|---|---|---|---|
| RY2 | 575595 | 108054 | Kerbside | 98.3% | 98.3% | 21.4 (3) | 20.5 | 20.1 | 27.1 | 22.3 |
- Annualisation has been conducted where data capture is <75% and >25% in line with LAQM.TG22.
Notes:
The annual mean concentrations are presented as µg/m3.
Exceedances of the PM10 annual mean objective of 40µg/m3 are shown in bold.
All means have been “annualised” as per LAQM.TG22 if valid data capture for the full calendar year is less than 75%. See Appendix C for details.
- Data capture for the monitoring period, in cases where monitoring was only carried out for part of the year.
- Data capture for the full calendar year (e.g. if monitoring was carried out for 6 months, the maximum data capture for the full calendar year is 50%).
- All means have been “annualised” as per Boxes 7.9 and 7.10 in LAQM.TG22 valid data capture for the full calendar year is less than 75%.
Figure A.3 – Trends in Annual Mean PM10 Concentrations
Table A.7 – 24-Hour Mean PM10 Monitoring Results, Number of PM10 24-Hour Means > 50µg/m3
| Site ID | X OS Grid Ref (Easting) | Y OS Grid Ref (Northing) | Site Type | Valid Data Capture for Monitoring Period (%) (1) | Valid Data Capture 2022 (%) (2) | 2018 | 2019 | 2020 | 2021 | 2022 |
|---|---|---|---|---|---|---|---|---|---|---|
| RY2 | 575595 | 108054 | Kerbside | 98.9 | 98.9 | 6 | 7 | 2 | 6 (31.7) | 0 |
Notes:
Results are presented as the number of 24-hour periods where daily mean concentrations greater than 50µg/m3 have been recorded. Exceedances of the PM10 24-hour mean objective (50µg/m3 not to be exceeded more than 35 times/year) are shown in bold.
If the period of valid data is less than 85%, the 90.4th percentile of 24-hour means is provided in brackets.
- Data capture for the monitoring period, in cases where monitoring was only carried out for part of the year.
- Data capture for the full calendar year (e.g. if monitoring was carried out for 6 months, the maximum data capture for the full calendar year is 50%).
Table A.8 – Annual Mean PM2.5 Monitoring Results (µg/m3)
| Site ID | X OS Grid Ref (Easting) | Y OS Grid Ref (Northing) | Site Type | Valid Data Capture for Monitoring Period (%) (1) | Valid Data Capture 2022 (%) (2) | 2018 | 2019 | 2020 | 2021 | 2022 |
|---|---|---|---|---|---|---|---|---|---|---|
| RY2 | 575595 | 108054 | Kerbside | 98 | 98 | 15 | 14.4 | 14.1 | 19.0 | 15.9(3) |
- Annualisation has been conducted where data capture is <75% and >25% in line with LAQM.TG22.
Notes:
The annual mean concentrations are presented as µg/m3.
All means have been “annualised” as per LAQM.TG22 if valid data capture for the full calendar year is less than 75%. See Appendix C for details.
- Data capture for the monitoring period, in cases where monitoring was only carried out for part of the year.
- Data capture for the full calendar year (e.g. if monitoring was carried out for 6 months, the maximum data capture for the full calendar year is 50%).
- This has been calculated using the National PMcoarse Roadside factor as outlined in Section 3.1.5: Particulate Matter (PM2.5).
Figure A.4 – Trends in Estimated Annual Mean PM2.5 Concentrations
Appendix B: Full Monthly Diffusion Tube Results for 2022
Table B.1 – NO2 2022 Diffusion Tube Results (µg/m3)
| DT ID | X OS Grid Ref (Easting) | Y OS Grid Ref (Northing ) | Jan | Feb | Mar | Apr | May | Jun | Jul | Aug | Sep | Oct | Nov | Dec | Annual Mean: Raw Data | Annual Mean: Annualised and Bias Adjusted (0.83) | Annual Mean: Distance Corrected to Nearest Exposure | Comment |
|---|---|---|---|---|---|---|---|---|---|---|---|---|---|---|---|---|---|---|
| DT3 | 578727 | 113439 | 36.9 | 32.6 | 31.0 | 26.5 | 30.2 | 31.6 | 35.8 | 30.0 | 30.0 | 36.1 | 31.5 | 29.7 | 31.8 | 26.4 | ||
| DT5 | 591196 | 120213 | 24.3 | 20.9 | 27.3 | 20.4 | 21.7 | 21.4 | 22.1 | 25.4 | 23.1 | 17.7 | 24.4 | 22.6 | 18.8 | |||
| DT8 | 591652 | 119148 | 22.5 | 15.8 | 23.5 | 19.2 | 19.5 | 18.9 | 19.0 | 21.4 | 21.3 | 19.6 | 20.1 | 20.9 | 20.2 | 16.7 | ||
| DT10 | 572742 | 113521 | 15.4 | 9.8 | 12.7 | 8.8 | 9.2 | 9.1 | 12.5 | 8.7 | 10.9 | 10.3 | 13.7 | 11.0 | 9.1 | |||
| DT12 | 571431 | 131224 | 37.9 | 21.0 | 36.4 | 28.6 | 23.6 | 25.6 | 8.7 | 34.2 | 34.6 | 30.2 | 24.2 | 30.7 | 28.0 | 23.2 | ||
| DT13 | 574357 | 116222 | 13.2 | 9.9 | 15.7 | 9.3 | 7.9 | 8.2 | 9.3 | 8.5 | 8.5 | 9.9 | 11.6 | 10.2 | 8.4 | |||
| DT14 | 574509 | 116846 | 16.0 | 27.8 | 22.6 | 21.3 | 22.5 | 21.2 | 24.3 | 24.3 | 21.1 | 27.1 | 22.8 | 18.9 | ||||
| DT17 | 592339 | 120975 | 16.4 | 11.6 | 16.7 | 11.6 | 9.6 | 9.9 | 10.9 | 9.9 | 10.9 | 11.9 | 17.1 | 12.4 | 10.3 | |||
| DT19 | 592121 | 120543 | 20.9 | 18.0 | 23.2 | 21.1 | 17.6 | 16.8 | 19.3 | 18.7 | 19.8 | 19.2 | 23.5 | 19.8 | 16.5 | |||
| DT21 | 592011 | 120148 | 36.1 | 34.0 | 28.9 | 27.2 | 28.2 | 31.6 | 35.1 | 30.3 | 30.4 | 26.3 | 33.3 | 31.0 | 25.8 | |||
| DT22 | 573985 | 107409 | 32.8 | 23.0 | 23.6 | 23.3 | 26.7 | 24.9 | 22.6 | 24.4 | 22.3 | 32.2 | 25.6 | 21.2 | ||||
| DT25 | 573871 | 108033 | 38.0 | 24.6 | 28.8 | 23.8 | 26.5 | 25.5 | 27.1 | 30.1 | 27.7 | 26.7 | 26.7 | 32.1 | 28.1 | 23.3 | ||
| DT27 | 575595 | 108060 | 27.7 | 16.4 | 26.1 | 20.8 | 17.2 | 15.8 | 19.8 | 19.5 | 18.6 | 16.4 | 17.5 | 24.5 | – | – | Triplicate Site with DT27, DT28 and DT29 – Annual data provided for DT29 only | |
| DT28 | 575595 | 108060 | 27.1 | 16.2 | 24.6 | 20.4 | 16.83 | 15.2 | 18.4 | 19.3 | 18.3 | 16.8 | 18.3 | 24.9 | – | – | Triplicate Site with DT27, DT28 and DT29 – Annual data provided for DT29 only | |
| DT29 | 575595 | 108060 | 30.0 | 16.4 | 23.8 | 18.3 | 17.24 | 15.5 | 19.3 | 18.9 | 19.0 | 16.7 | 18.2 | 23.7 | 19.8 | 16.5 | Triplicate Site with DT27, DT28 and DT29 – Annual data provided for DT29 only | |
| DT30 | 592248 | 120525 | 29.2 | 17.9 | 22.0 | 18.8 | 18.2 | 15.1 | 17.5 | 19.4 | 22.0 | 19.9 | 21.5 | 23.9 | 20.4 | 17.0 | ||
| DT31 | 570366 | 107817 | 29.1 | 20.5 | 28.4 | 22.5 | 19.3 | 19.0 | 23.1 | 23.5 | 22.8 | 21.7 | 23.1 | 23.3 | 23.0 | 19.1 | ||
| DT32 | 573508 | 115907 | 28.1 | 22.7 | 24.1 | 15.4 | 20.1 | 19.9 | 20.3 | 16.6 | 20.4 | 17.7 | 19.5 | 22.1 | 20.6 | 17.1 | ||
| DT33 | 573601 | 109437 | 30.5 | 18.8 | 11.1 | 20.3 | 17.5 | 21.3 | 25.3 | 22.7 | 23.5 | 23.8 | 20.8 | 25.7 | 21.8 | 18.1 | ||
| DT34 | 574736 | 116123 | 22.6 | 16.6 | 15.0 | 12.1 | 15.3 | 13.3 | 14.3 | 15.9 | 16.5 | 18.6 | 16.0 | 13.3 | ||||
| DT35 | 573349 | 127206 | 23.3 | 20.1 | 27.9 | 17.7 | 20.2 | 19.7 | 20.7 | 21.2 | 19.2 | 25.5 | 21.5 | 17.9 | ||||
| DT36 | 582877 | 116604 | 10.9 | 8.3 | 13.7 | 7.9 | 7.1 | 7.1 | 29.8 | 7.8 | 8.6 | 8.4 | 8.0 | 13.3 | 10.9 | 9.0 |
- All erroneous data has been removed from the NO2 diffusion tube dataset presented in Table B.1.
- Annualisation has been conducted where data capture is <75% and >25% in line with LAQM.TG22.
- Local bias adjustment factor used. National bias adjustment factor used.
- Where applicable, data has been distance corrected for relevant exposure in the final column.
- Rother District Council confirm that all 2022 diffusion tube data has been uploaded to the Diffusion Tube Data Entry System.
Notes:
Exceedances of the NO2 annual mean objective of 40µg/m3 are shown in bold.
NO2 annual means exceeding 60µg/m3, indicating a potential exceedance of the NO2 1-hour mean objective are shown in bold and underlined. See Appendix C for details on bias adjustment and annualisation.
Appendix C: Supporting Technical Information / Air Quality Monitoring Data QA/QC
New or Changed Sources Identified Within Rother District Council During 2022
RDC has not identified any new sources relating to air quality within the reporting year of 2022.
Additional Air Quality Works Undertaken by Rother District Council During 2022
RDC has not completed any additional works within the reporting year of 2022.
QA/QC of Diffusion Tube Monitoring
AIR is an independent analytical proficiency-testing (PT) scheme, operated by LGC Standards and supported by the Health and Safety Laboratory (HSL). AIR PT is a new scheme, started in April 2014, which combines two long running PT schemes: LGC Standards STACKS PT scheme and HSL Workplace Analysis Scheme for Proficiency (WASP) PT scheme.
Defra and the Devolved Administrations advise that diffusion tubes used for Local Air Quality Management should be obtained from laboratories that have demonstrated satisfactory performance in the AIR PT scheme.
RDC used Gradko International for the supply and analysis of diffusion tubes, with a 20% triethanolamine (TEA) in water preparation.
The percentage of results submitted by Gradko International Ltd that were subsequently determined to be satisfactory was 100% for AIR-PT Round AR050 (May – June 2022). These scores should be taken into account when interpreting the data.
All monitoring has been completed in adherence with the LAQM 2022 Diffusion Tube Monitoring Calendar.
Diffusion Tube Annualisation
All diffusion tube monitoring locations within RDC recorded data capture of 75% therefore it was not required to annualise any monitoring data. In addition, any sites with a data capture below 25% do not require annualisation.
Diffusion Tube Bias Adjustment Factors
The diffusion tube data presented within the 2022 ASR have been corrected for bias using an adjustment factor. Bias represents the overall tendency of the diffusion tubes to under or over-read relative to the reference chemiluminescence analyser. LAQM.TG22 provides guidance with regard to the application of a bias adjustment factor to correct diffusion tube monitoring. Triplicate co-location studies can be used to determine a local bias factor based on the comparison of diffusion tube results with data taken from NOx/NO2 continuous analysers. Alternatively, the national database of diffusion tube co-location surveys provides bias factors for the relevant laboratory and preparation method.
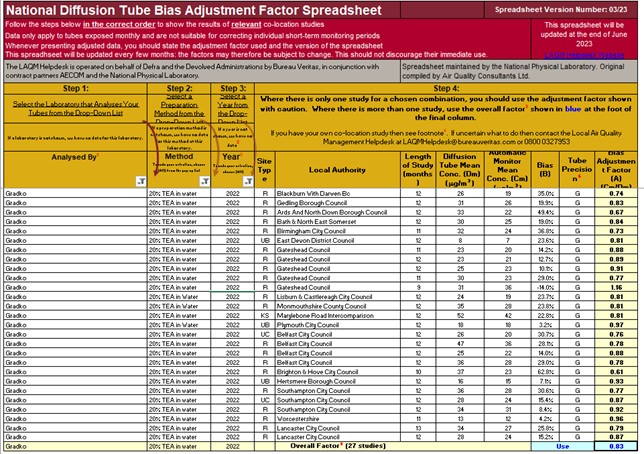
RDC have applied a national bias adjustment factor of 0.83 to the 2022 monitoring data. A summary of bias adjustment factors used by RDC over the past five years is presented in Table C.1.
RDC has a co-location of triplicate diffusion tubes alongside the automatic continuous analyser at De La Warr Road, Bexhill. The local bias adjustment factor using these locations was calculated to be 0.75 as detailed inError! Reference source not found..
In 2022, it was possible to derive a local bias adjustment factor as well as the national bias adjustment factor obtained from the national database (0.83, 27 studies, version 03/23). A local bias adjustment factor is generally preferred as recommended by LAQM.TG22.
However, in this occasion the national factor was chosen instead due to being more conservative. The national factor was higher than the local derived factor for Rother so provides a worst-case scenario, which is likely to be more appropriate for the entire network of monitoring sites in RDC.
Table C.2 – Bias Adjustment Factor
| Monitoring Year | Monitoring Year | If National, Version of National Spreadsheet | Adjustment Factor |
|---|---|---|---|
| 2022 | National | 03/23 | 0.83 |
| 2021 | National | 03/22 | 0.84 |
| 2020 | Local | 03/21 | 0.88 |
| 2019 | Local | 03/20 | 0.97 |
| 2018 | Local | 03/19 | 0.93 |
Figure C.1 – National Diffusion Tube Bias Adjustment Factor for Rother District Council (Gradko)
| Description | Local Bias Adjustment Input 1 |
|---|---|
| Periods used to calculate bias | 11 |
| Bias Factor A | 0.75 (0.69 – 0.83) |
| Bias Factor B | 33% (20% -45%) |
| Diffusion Tube Mean (µg/m3) | 20.1 |
| Mean CV (Precision) | 3.0% |
| Automatic Mean (µg/m3) | 15.1 |
| Data Capture | 99% |
| Adjusted Tube Mean (µg/m3) | 15 (14 – 17) |
NO2 Fall-off with Distance from the Road
Wherever possible, monitoring locations are representative of exposure. However, where this is not possible, the NO2 concentration at the nearest location relevant for exposure has been estimated using the Diffusion Tube Data Processing Tool/NO2 fall-off with distance calculator available on the LAQM Support website. Where appropriate, non- automatic annual mean NO2 concentrations corrected for distance are presented in Table B.1.
No diffusion tube NO2 monitoring locations within RDC required distance correction during 2022.
QA/QC of Automatic Monitoring
As previously described in Section 2.1, monitoring stations within Rother are part of the SAQMN and, therefore, measurements made at these sites are traceable to national standards and operational procedures defined for the regional network. WeCare4Air undertakes the equipment’s maintenance and calibration.
PM10 and PM2.5 Monitoring Adjustment
The PM10 data from the TEOM continuous analyser at De La Warr Road (RY2) has been corrected using the volatile correction model7 (VCM) to ensure gravimetric equivalence.
PM10 annual average concentrations have used to estimate PM2.5 concentrations by using the methodology outlined in Defra’s Technical Guidance LAQM.TG.22.
Automatic Monitoring Annualisation
All automatic monitoring locations within RDC recorded data capture of greater than 75% therefore it was not required to annualise any monitoring data. In addition, any sites with a data capture below 25% do not require annualisation.
NO2 Fall-off with Distance from the Road
Wherever possible, monitoring locations are representative of exposure. However, where this is not possible, the NO2 concentration at the nearest location relevant for exposure
has been estimated using the NO2 fall-off with distance calculator available on the LAQM Support website. Where appropriate, non-automatic annual mean NO2 concentrations corrected for distance are presented in Table B.1.
No automatic NO2 monitoring locations within RDC required distance correction during 2022, as concentrations were below 36 µg/m3.
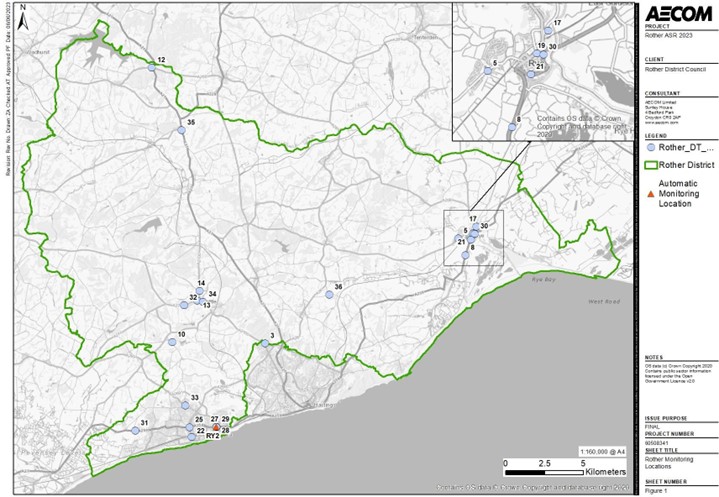
Appendix D: Map(s) of Monitoring Locations and AQMAs
Figure D.1 – Map of Monitoring Sites
Appendix E: Summary of Air Quality Objectives in England
Table E.1 – Air Quality Objectives in England8
| Pollutant | Air Quality Objective: Concentration | Air Quality Objective: Measured as |
|---|---|---|
| Nitrogen Dioxide (NO2) | 200µg/m3 not to be exceeded more than 18 times a year | 1-hour mean |
| Nitrogen Dioxide (NO2) | 40µg/m3 | Annual mean |
| Particulate Matter (PM10) | 50µg/m3, not to be exceeded more than 35 times a year | 24-hour mean |
| Particulate Matter (PM10) | 40µg/m3 | Annual mean |
| Sulphur Dioxide (SO2) | 350µg/m3, not to be exceeded more than 24 times a year | 1-hour mean |
| Sulphur Dioxide (SO2) | 125µg/m3, not to be exceeded more than 3 times a year | 24-hour mean |
| Sulphur Dioxide (SO2) | 266µg/m3, not to be exceeded more than 35 times a year | 15-minute mean |
- The units are in microgrammes of pollutant per cubic metre of air (µg/m3).
Glossary of Terms
| Abbreviation | Description |
|---|---|
| AQAP | Air Quality Action Plan – A detailed description of measures, outcomes, achievement dates and implementation methods, showing how the local authority intends to achieve air quality limit values’ |
| AQMA | Air Quality Management Area – An area where air pollutant concentrations exceed / are likely to exceed the relevant air quality objectives. AQMAs are declared for specific pollutants and objectives |
| ASR | Annual Status Report |
| AQS | Air Quality Strategy |
| Defra | Department for Environment, Food and Rural Affairs |
| DMRB | Design Manual for Roads and Bridges – Air quality screening tool produced by National Highways |
| EU | European Union |
| FDMS | Filter Dynamics Measurement System |
| LAQM | Local Air Quality Management |
| NO2 | Nitrogen Dioxide |
| NOx | Nitrogen Oxides |
| PM10 | Airborne particulate matter with an aerodynamic diameter of 10µm or less |
| PM2.5 | Airborne particulate matter with an aerodynamic diameter of 2.5µm or less |
| QA/QC | Quality Assurance and Quality Control |
| SAQMN | Sussex Air Quality Monitoring Network |
| SCC | Sussex County Council |
| SO2 | Sulphur Dioxide |
| VCM | Volatile Correction Method |
| WASP | Workplace Analysis Scheme for Proficiency |
References
- Local Air Quality Management Technical Guidance LAQM.TG22. August 2022. Published by Defra in partnership with the Scottish Government, Welsh Assembly Government and Department of the Environment Northern Ireland.
- Local Air Quality Management Policy Guidance LAQM.PG22. August 2022. Published by Defra in partnership with the Scottish Government, Welsh Assembly Government and Department of the Environment Northern Ireland.
- Sussex Air Quality Partnership – Sussex-air website.
- Sussex Air Quality Partnership Air Quality Strategic Plan 2010
- National Diffusion Tube Bias Adjustment Factor Spreadsheet, Spreadsheet Version Number: 03/23. Defra, 2023.
- Air Quality Annual Status Report for Rother District Council, 2022.
- LGC (2019) Summary of Laboratory Performance in AIR NO2 Proficiency Testing Scheme (January 2019 – June 2022) Available at: WASP – Annual Performance